Prometheus Metrics
GOST internally provides monitoring data through the Prometheus metrics.
Start Metrics Service
The metrics service supports two modes: global service and normal service.
When using global service and reloading configuration using the web API, the service will not be affected.
Global Service
Define the metrics service via the command line -metrics or the metrics object in the configuration file.
services:
- name: service-0
  addr: ":8080"
  handler:
    type: auto
  listener:
    type: tcp

metrics:
  addr: :9000
  # also support unix domain socket
  # addr: unix:///var/run/gost.sock
  path: /metrics
  auth:
    username: user
    password: pass
  auther: auther-0
metrics.addr(string)- Metrics HTTP API service addresss
metrics.path(string, default=/metrics)- API path
Normal Service
3.1.0
When running as a normal service, you can use all the functions supported by service.
Authentication
Authentication uses HTTP Basic Auth.
Authentication information can be set through the auth or auther option. If the auther option is set, the auth option is ignored.
After enabling, you can view the metrics data through the http://localhost:9000/metrics endpoint.
Metrics
gost_chain_errors_total{chain="chain-0",host="host-0"} 1

gost_service_handler_errors_total{host="host-0",service="service-0"} 1

gost_service_request_duration_seconds_bucket{host="host-0",service="service-0",le="0.005"} 0
gost_service_request_duration_seconds_bucket{host="host-0",service="service-0",le="0.01"} 0
gost_service_request_duration_seconds_bucket{host="host-0",service="service-0",le="0.025"} 0
gost_service_request_duration_seconds_bucket{host="host-0",service="service-0",le="0.05"} 0
gost_service_request_duration_seconds_bucket{host="host-0",service="service-0",le="0.1"} 0
gost_service_request_duration_seconds_bucket{host="host-0",service="service-0",le="0.25"} 1
gost_service_request_duration_seconds_bucket{host="host-0",service="service-0",le="0.5"} 1
gost_service_request_duration_seconds_bucket{host="host-0",service="service-0",le="1"} 1
gost_service_request_duration_seconds_bucket{host="host-0",service="service-0",le="2.5"} 1
gost_service_request_duration_seconds_bucket{host="host-0",service="service-0",le="5"} 1
gost_service_request_duration_seconds_bucket{host="host-0",service="service-0",le="10"} 1
gost_service_request_duration_seconds_bucket{host="host-0",service="service-0",le="15"} 1
gost_service_request_duration_seconds_bucket{host="host-0",service="service-0",le="30"} 2
gost_service_request_duration_seconds_bucket{host="host-0",service="service-0",le="60"} 2
gost_service_request_duration_seconds_bucket{host="host-0",service="service-0",le="+Inf"} 2
gost_service_request_duration_seconds_sum{host="host-0",service="service-0"} 15.172895206
gost_service_request_duration_seconds_count{host="host-0",service="service-0"} 2

gost_service_requests_in_flight{host="host-0",service="service-0"} 0

gost_service_requests_total{host="host-0",service="service-0"} 2

gost_service_transfer_input_bytes_total{host="host-0",service="service-0"} 1018

gost_service_transfer_output_bytes_total{host="host-0",service="service-0"} 7327

    gost_recorder_records_total{host="host-0",recorder="recorder-0"} 5

gost_services{host="host-0"} 1
Metrics Description
gost_services(type=gauge)- Current number of services
gost_service_requests_total(type=counter)- Total number of requests
gost_service_transfer_input_bytes_total(type=counter)- Total service input data transfer size in bytes
gost_service_transfer_output_bytes_total(type=counter)- Total service output data transfer size in bytes
gost_service_requests_in_flight(type=gauge)- Current in-flight requests
gost_service_request_duration_seconds_*(type=histogram)- Distribution of request latencies
gost_service_handler_errors_total(type=counter)- Total service handler errors
gost_chain_errors_total(type=counter)- Total chain connection errors
gost_recorder_records_total3.2.0 (type=counter)- Total records written by recorder. Labels:
host,recorder
Prometheus
Example of prometheus configuration file prometheus.yaml:
global:
  scrape_interval: 15s
# A list of scrape configurations.
scrape_configs:
  - job_name: 'gost'
    scrape_interval: 5s
    static_configs:
      - targets: ['127.0.0.1:9000']
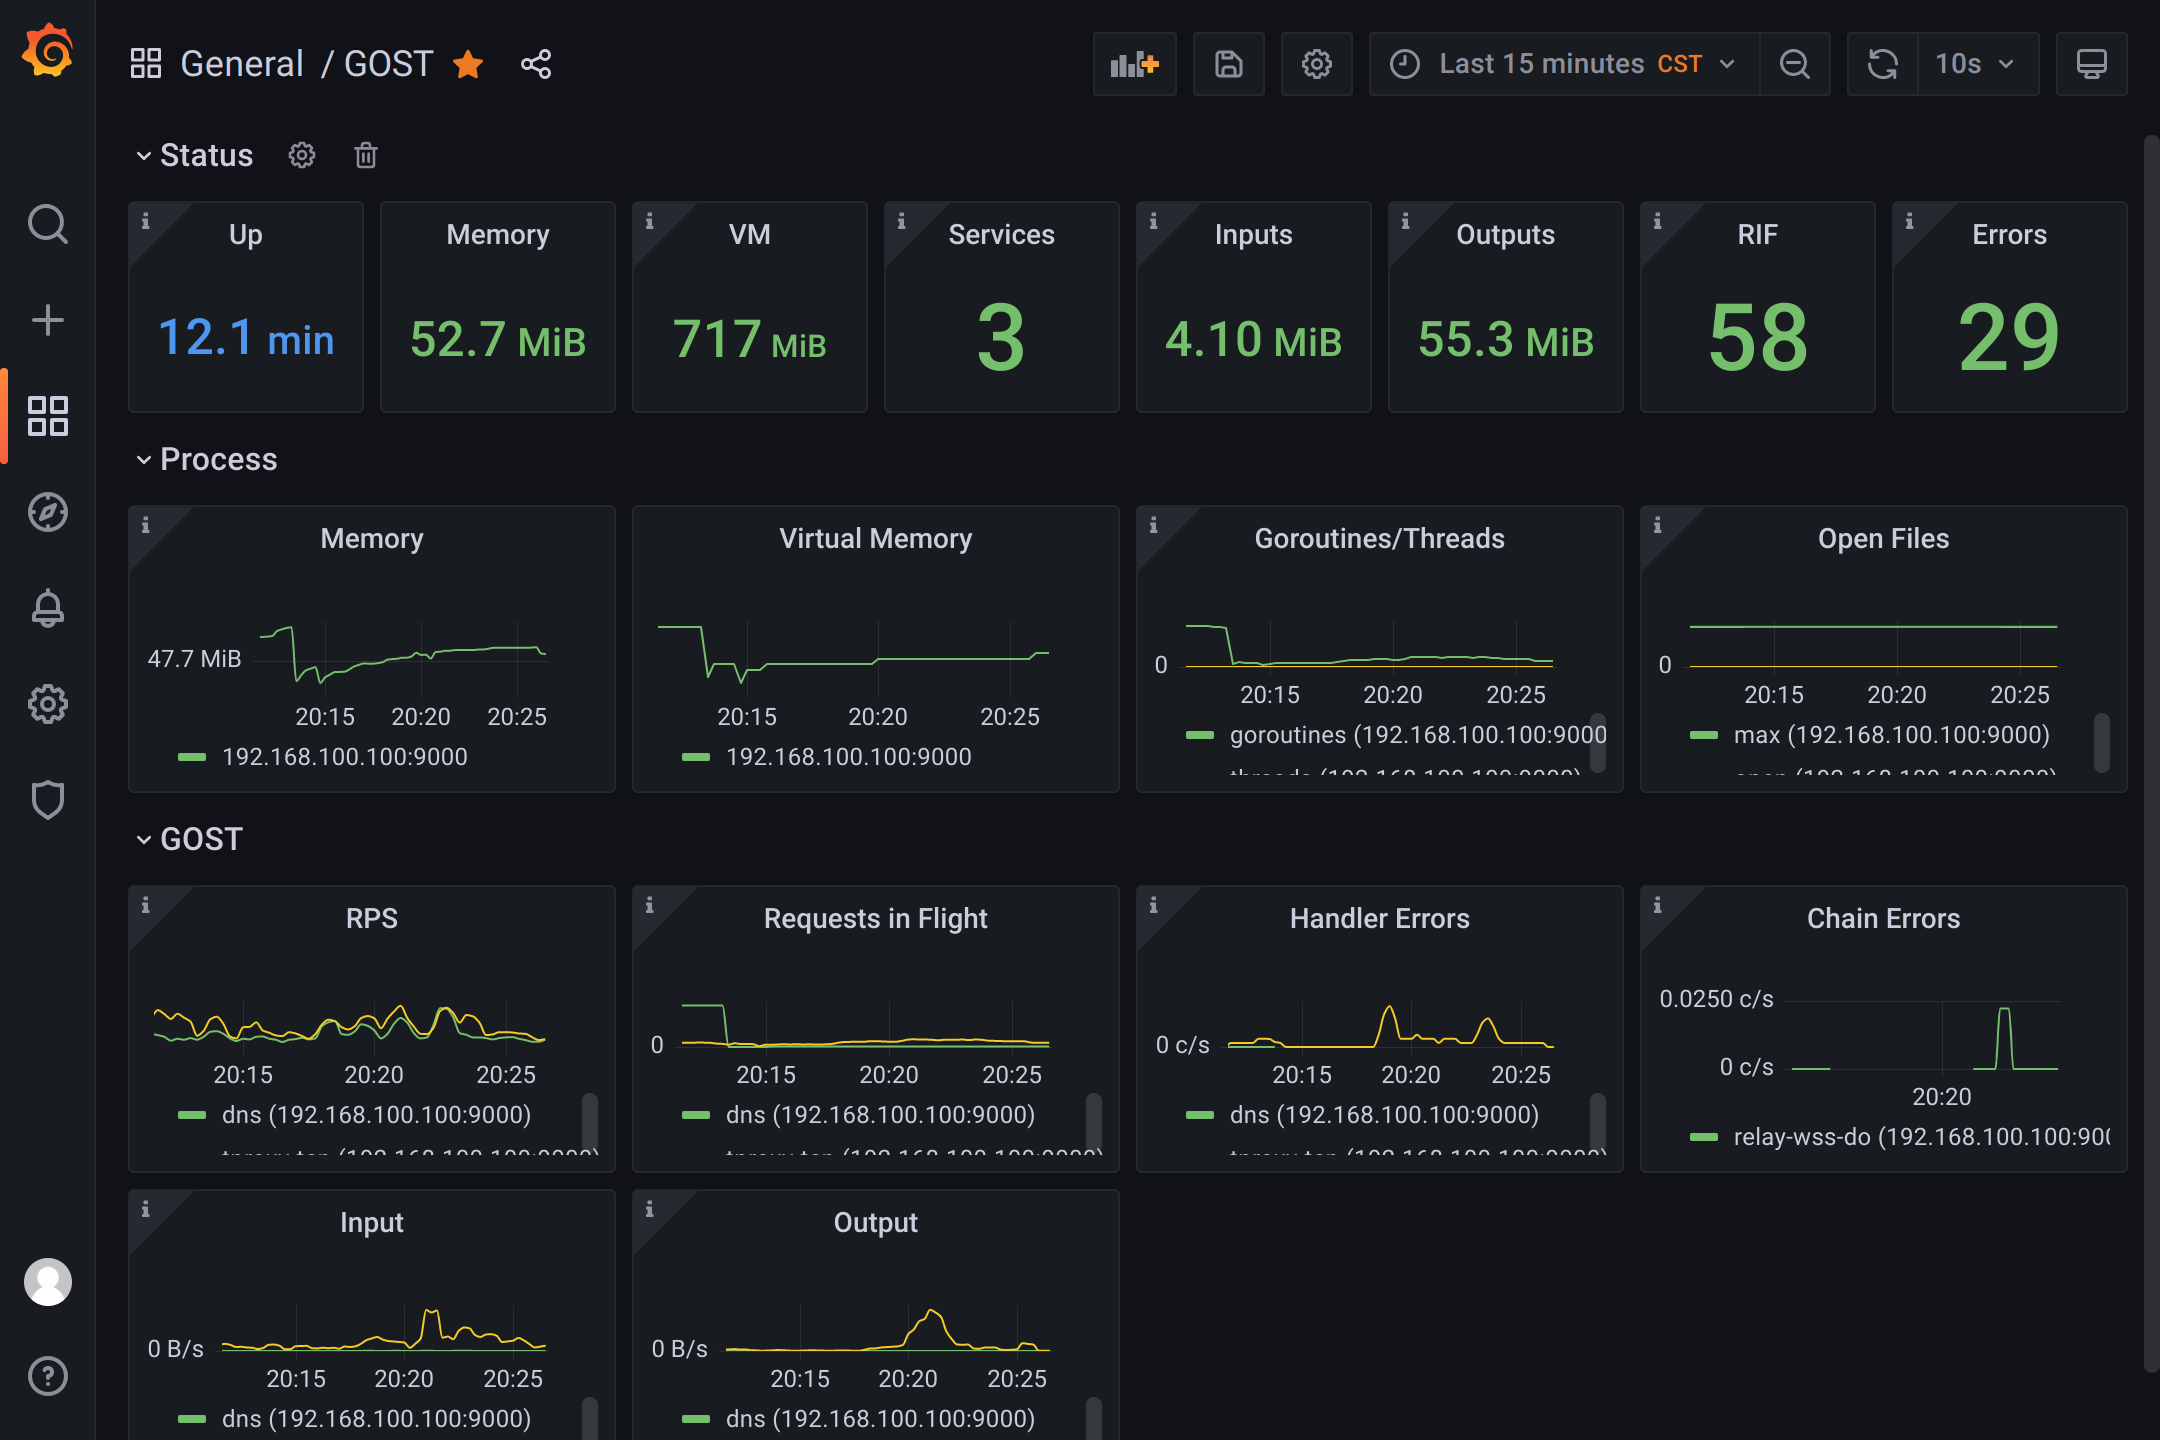
Grafana Dashboard
You can use the following Dashboard to present metrics data.
https://grafana.com/grafana/dashboards/16037